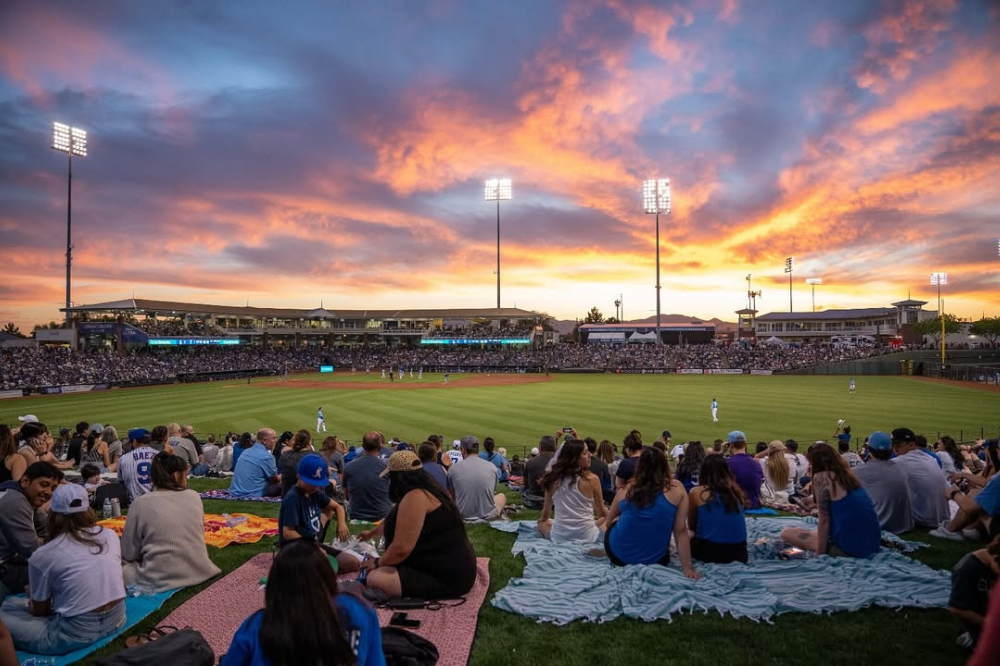
Experience the excitement of spring training at Surprise Stadium, which has been voted the No. 1 spring training facility by USA Today. Hosting 30 games this season, the stadium is the spring training home for the Kansas City Royals and Texas Rangers and will host an assortment of fun events all spring long. These include charity games, Pup Nights, firework nights, Out of the Park Music Fest (with performances from country star Russell Dickerson and Niko Moon on March 21), Stadium Storytime, sensory awareness days, and many more.
Food: Fans can bring food in a one-gallon clear Ziploc or freezer bag. The stadium also features ballpark classics like tacos and hot dogs, as well as the Budweiser Legends Deck’s premium dining options with catered meals from The Links Neighborhood Grill, Rio Mirage Cafe, Outback Steakhouse, Macayo’s Mexican Food, Saigon Kitchen, Barrio Queen, and Bonfire Craft Kitchen & Taphouse.
Bag Policy: Clear totes up to 12-in. by 6-in. by 12-in. and small clutch purses no larger than 5-in. x 8-in. are permitted. Medical and diaper bags for children are allowed. All bags are subject to search.
Tickets: www.surprisestadium.com.
Sloan Park: Chicago Cubs and New York Yankees
Sloan Park is the ultimate spring training destination for Chicago Cubs fans, featuring a spacious 15,000-seat stadium and seven practice fields. The baseball park will also host the renowned New York Yankees this season, debuting for the first time during Arizona’s spring training. Opened in 2014, it’s the largest spring training stadium in the country, offering a game-day atmosphere that rivals Wrigley Field. Fans can expect exciting baseball action, interactive fan zones, and plenty of photo opportunities with Cubs mascots and players. The stadium’s architecture even features nods to Chicago’s baseball heritage, making it a must-visit for Cubs enthusiasts.
Food: Levy Restaurants manages all food, beverage, and merchandise. Concession options include nachos, burgers, wraps, tacos, and hot dogs. Factory-sealed plastic bottles and small personal food bags are allowed. Be sure to try the classic Chicago-style hot dog for an authentic taste of the Windy City.
Bag Policy: Backpacks and bags larger than 16-in. by 16-in. by 8-in. are prohibited. Small purses, drawstring bags, and soft-sided coolers are permitted. Medical and diaper bags are allowed.
Tickets: www.mlb.com.
Scottsdale Stadium: San Francisco Giants
In the heart of Old Town Scottsdale, Scottsdale Stadium provides a premium baseball experience for San Francisco Giants fans. With its intimate setting and stunning city views, it offers one of the most unique environments in the Cactus League. The stadium is known for its passionate fanbase and easy access to nearby restaurants, bars, and entertainment options. New this season is an assortment of events taking place all spring long, including Dog Day (permitting furry friends to attend game day) on March 1 and Youth Baseball & Softball Day (where kiddos can come before the game and meet players and their coaches) on March 12 (to name a few).
Food: Fans can indulge in traditional ballpark classics like bratwurst, pizza, nachos, and pretzels, as well as local favorites such as gourmet tacos and BBQ specialties.
Bag Policy: Only small clutch purses (9-in. by 5-in.), clear totes (12-in. by 12-in. by 6-in.), medical bags, and diaper bags are permitted. No backpacks.
Tickets: scottsdalestadium.com.
Tempe Diablo Stadium: Los Angeles Angels
Home to the Los Angeles Angels since 1968, Tempe Diablo Stadium offers an intimate baseball atmosphere with a variety of food options. With its stunning views of the Tempe Buttes, this stadium provides one of the most picturesque backdrops in the Cactus League. It’s a favorite among fans for its relaxed atmosphere and excellent sightlines, which allow for up-close interactions with players. The stadium underwent renovations in recent years, improving seating, concessions, and fan amenities while maintaining its old-school charm.
Food: Legends Hospitality operates five concession locations. Specialty food vendors can be found on the left-field plaza and right-field patio. The stadium is known for offering a wide range of ballpark classics, including hot dogs, bratwurst, and local Arizona-inspired flavors.
Bag Policy: Clear plastic or vinyl bags no larger than 12.75-in. by 6.5-in. by 12.75-in. are permitted. Medical and diaper bags are allowed.
Tickets: www.tempe.gov.
Salt River Fields at Talking Stick: Arizona Diamondbacks & Colorado Rockies
This state-of-the-art facility is home to the Arizona Diamondbacks and Colorado Rockies. Featuring lush, sprawling fields and modern amenities, Salt River Fields is known for its family-friendly atmosphere and special events throughout spring training, with upcoming happenings including Kids Run the Bases (dates vary), Hispanic Heritage Day (March 3), Adopt-A-Pup Day (March 7), and more to look forward to all season long.
Food: Concession highlights include Cold Stone Creamery, Rusty Tacos, Chick-fil-A, Cactus Corn, and Home Plate Hot Dogs.
Bag Policy: Soft-sided bags up to 16-in. by 16-in. by 8-in. are allowed and subject to search.
Tickets: saltriverfields.com.
American Family Fields of Phoenix: Milwaukee Brewers
Catch a foul ball at American Family Fields of Phoenix. With a seating capacity of 7,000-plus and a lush outfield berm, this award-winning Cactus League facility offers a relaxed setting to enjoy action-packed spring training games. The recent renovations have improved fan comfort by expanding seating, improving shade structures, and upgrading players’ training facilities.
Food: Treat yourself to a culinary adventure with options like Third Base Smokehouse, Game Day Grill, and Ballpark Classics. Be sure to try the Wisconsin bratwursts, a nod to the Brewers’ home state.
Bag Policy: The bag policy is strict, allowing only clear single-compartment bags that do not exceed 12-in. by 12-in. by 6-in.
Tickets: www.mlb.com.
Goodyear Ballpark: Cleveland Guardians & Cincinnati Reds
Discover the ultimate baseball experience at Goodyear Ballpark, home to Ohio’s Major League Baseball teams, the Cleveland Guardians and Cincinnati Reds. The stadium offers a variety of seating options, from grassy berms for a laidback experience to luxury suites with excellent field views. The ballpark also hosts interactive events for fans, such as player meet-and-greets and autograph sessions.
Food: A diverse selection of specialty food carts offers everything from gourmet burgers to street tacos, ensuring a wide range of choices. There are four signature fixed concession stands and portable sales units throughout the ballpark. New this season is fare inspired by the stadium’s hosted teams, including Ohio classics like Cleveland Polish Boys and Cincinnati Skyline Coneys.
Bag Policy: Guests may bring small bags and purses if they do not exceed the 16-in. by 16-in. by 8-in. Major League Baseball size requirement. All bags are subject to search.
Tickets: goodyearbp.com.
Camelback Ranch-Glendale: Los Angeles Dodgers & Chicago White Sox
Celebrating its 18th season as a spring training home for the Chicago White Sox and Los Angeles Dodgers, Camelback Ranch-Glendale offers more than just top-quality playing fields. Fans can explore picturesque walking trails, beautifully landscaped grounds, and citrus groves. The stadium’s 141-acre complex includes 13 practice fields and a scenic lake that serves as a focal point of the facility.
Food: With 30 food locations throughout the complex, choices seem endless at this ballpark. Examples include staple fare like Dodger Dogs, Cracker Jacks, burgers, as well as fare from restaurants like 3 Amigos Bar, Wok Off Noodles, Baseline Patio Sausage Grill, and many more.
Bag Policy: Clear bags up to 12-in. by 12-in. by 6-in. are permitted. Medical and diaper bags for children are allowed. All bags are subject to search.
Tickets: www.mlb.com.
Peoria Sports Complex: Seattle Mariners & San Diego Padres
Home to the Seattle Mariners and San Diego Padres this season, Peoria Sports Complex has all of your spring training needs covered. Located in Peoria’s entertainment district, the complex offers premier indoor and outdoor areas and plenty of fan engagement opportunities. An assortment of speciality events will be taking place at the stadium this season, including Kids Run the Bases nights, charitable Bark at the Park days (allowing fans to bring their furry friends to the game!), and more. The stadium features shaded seating, a spectacular children’s playground, and interactive areas where fans can watch batting practice up close. Unique to other spring training facilities, Peoria Sports Complex offers an assortment of discounted tickets, including savings for Peoria residents, educators, first responders, and more.
Food: Peoria Sports Complex is known for its wide variety of food and craft beer in the league. Levy Restaurants provides food and beverage services, offering everything from traditional ballpark favorites to gourmet options such as gyros, noodle bowls, churros, hot sandwiches, and more.
Bag Policy: No bags, purses, or backpacks are permitted, except for medical bags, diaper bags, and clear plastic storage bags up to 12-in. by 12-in. by 6-in. Small clutch bags and wallets within a clear tote must not exceed 4.5-in. by 6.5-in.
Tickets: www.peoriasportscomplex.com.
ARTICLE PROVIDED BY: Kenzie Barrena is a multifaceted writer based in Scottsdale, Arizona.
FABULOSA ARIZONA